This knowledgebase article will demonstrate how the percentages are calculated on the Common Absences page in Analytics.

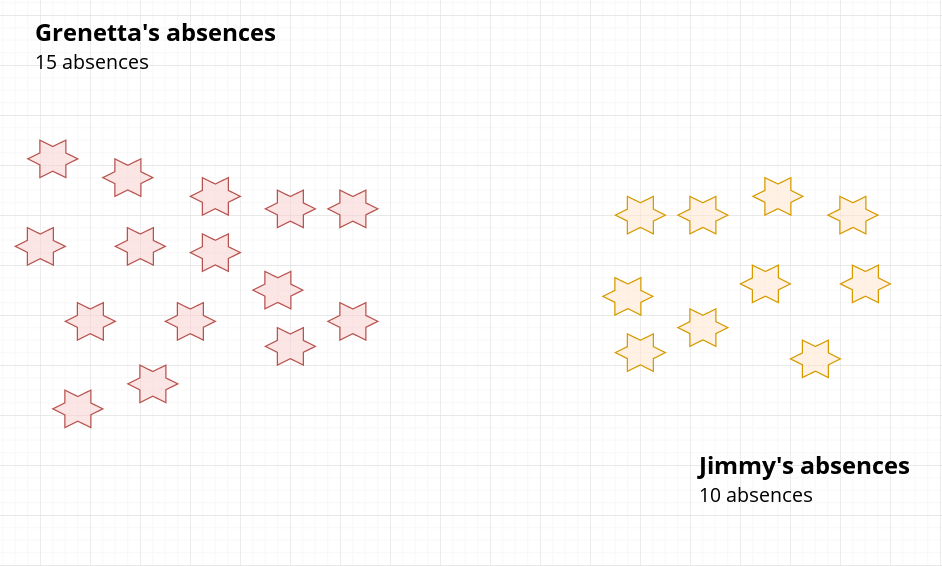
The diagram below shows the absent attendance records for two pupils: Grenetta and Jimmy. Grenetta has a total of 15 absences and Jimmy has a total of 10 absences. This is where the values of 15 and the 10 come from in the screenshot above.
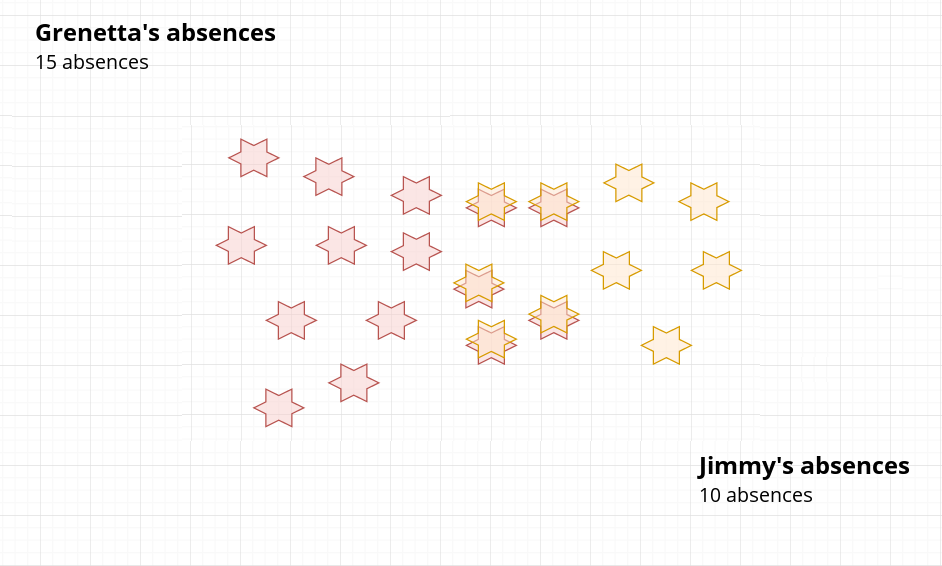
When the two sets of absent attendance records are overlapped, it reveals both pupils were absent together 5 times. This is where the values of 5 come from in the initial screenshot.
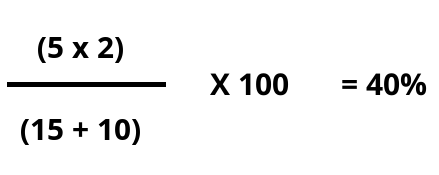
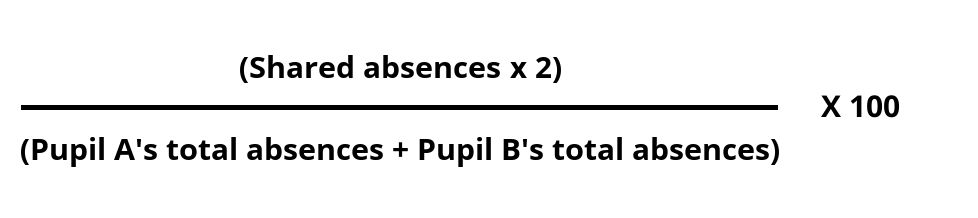
We then use the equation below to work out the common absences percentage for the two pupils.
Using the example from this knowledgebase article, we arrive at the as 40% shown in the initial screenshot.