Class Charts will make waves in American Class Room Management
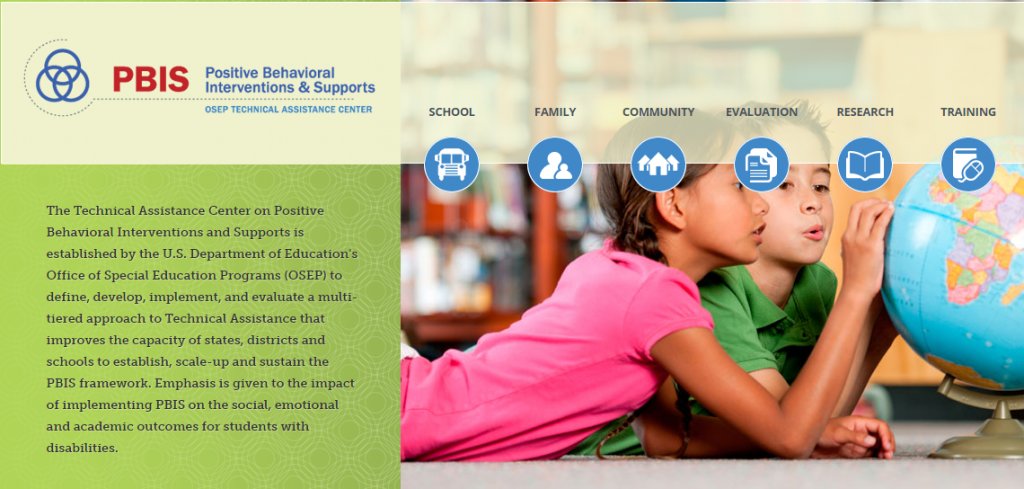
Our American friends may be aware of the US Department of Education’s Office for Special Education Programs. Conveniently known as OSEP, it has been created to ‘define, develop, implement, and evaluate a multi-tiered approach to Technical Assistance that improves the capacity of state, districts and schools to establish, scale-up and sustain the PBIS framework’.
In OSEP’s own words, they work with schools to improve the social culture and behavioral climate of classrooms in schools.

The PBIS Framework – Class Charts wil dot the i’s and cross the t’s for your own Behavior Framework.
OSEP is at the center of a spectrum of Educational data research and analysis in the US. At the apex of OSEP is the PBIS ideology – otherwise known as Positive Behavioral Intervention and Supports.
The PBIS Framework enables faculty members to:
- Organise evidence based practices
- Improve practice implementation
- maximise academic and social outcomes for students
PBIS is a framework that focuses on applying behavior analytics to study and support behavioral practices and interventions within academic environments. They are primarily concerned with ensuring ‘PBIS Systems’ are established so faculty members can intervene effectively and accurately at school, district and state levels.
The conclusion being that when PBIS Framework Based Systems recommended by OSEP are implemented in the classroom, educational and social outcomes in that class are optimized.
The data utilized by OSEP and the research carried out speak volumes. We highly recommend a deeper look into their interesting work at www.pbis.org.
PBIS & Effective Class Room Management
So why are we so laudative about the PBIS Framework set out by OSEP?
Thanks to this framework, the strategy is simple. Understand, Organize, Implement and Unify academic and social climates within the classroom.
A statement ripe with sentiment, but not wholly prescriptive on how to achieve this goal.
You probably know the story by now. Duncan is our CEO; he was a head of year, a SENCO, head of department, class teacher. . .the list goes on. He has been in the mire of behaviour and classroom management as a teacher for 16 years.
By combining his personal experience with the research of OSEP and similar organisations, he created Class Charts to combat the organisational nightmare of strategising, recording and analysing classroom data for his classes.
It is capable of fulfilling any teacher’s desire to meet PBIS frameworks, smash OSEP targets and optimise class room behaviour for the very best social and academic outcomes.
- We can display any student data you need to see on pupil cards, including SAT Scores, Test Results, Reading Ages…if you measure it, we can display it.
- Let our algorithms cluster and disperse these pupils throughout the class…Most teachers might have a Teaching Assistant in a number of their classes for instance. Class Charts will cluster all of your Special Education Needs pupils in one area of the class so the assistant doesn’t need to drift from one end to the other.
- Record any and all behavior instances and report on these through our Analytics tools…see not only who behaviors the most positively, but when, which class, with which teacher…If you need to report on it, we can give you the tools to do so.
- Out Artificial Intelligence within Class Charts knows exactly who sits where in every class, and knows how they behave in the those classes. Let our AI system optimize your seating plan to optimize for interactions…meaning every student is surrounded as much positive influences as possible.
These are just a few of the key features to make sure you have the tools you need to do the job you wanted to do.
The Class Charts mantra is simple. Less Disruption, more Learning – More Learning, Less Disruptive. It is a self fulfilling prophecy.
For more infomation as always, follow us on Twitter on @ClassCharts and explore the Class Charts Website.
