Class Charts allows you to create powerful attendance reports that can track session attendance throughout your school.
To start creating your own session attendance reports, click on the Analytics tab at the top of the page.

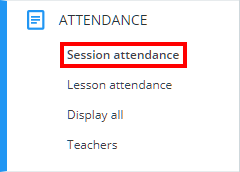
You will appear on the Analytics home page. Select the Attendance option from the menu on the left hand side and click on the Session attendance option.
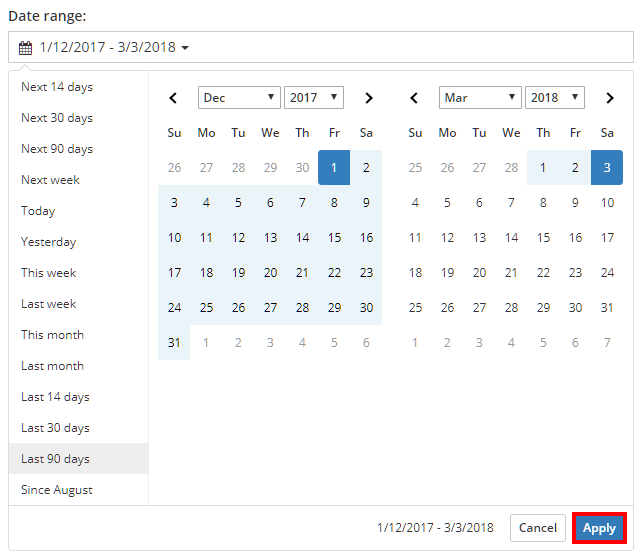
First, select the date range that the report will cover by clicking on the Date range field. A date picker will appear that allows you to select from preset date ranges or a custom range of your choice. Click on the Apply button once you have decided.
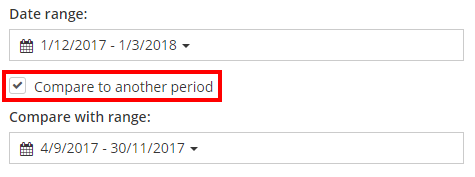
In addition to creating a session attendance report for a specific date range, you can also compare the attendance records to records in a second date range. Tick the Compare to another period check box and specify a comparison range.
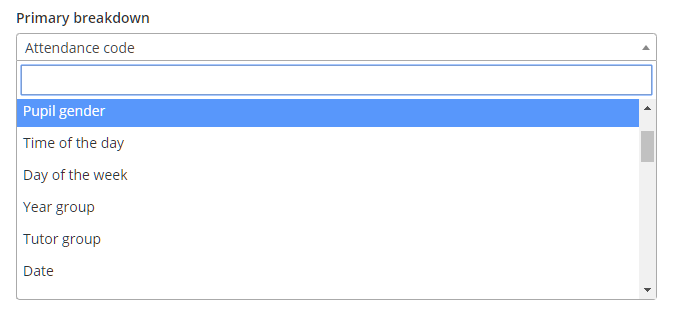
To generate a report, a primary breakdown must be specified so that the results can be broken down in to specific categories. Select a breakdown option from the drop down menu.
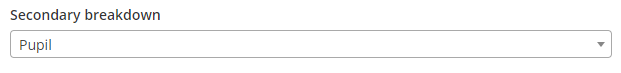
Once a primary breakdown has been selected, an optional secondary breakdown can be used to further categorise the results of the report.
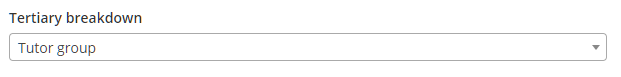
If a secondary breakdown has been applied, you can also apply a tertiary breakdown to your report.
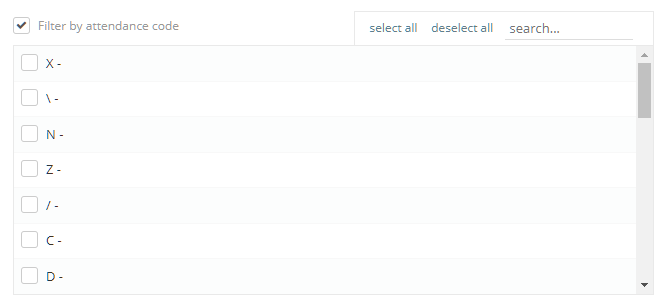
If the session attendance report is too general for your needs, you can apply various filters that refine the results. To apply a filter, tick a filter option checkbox and select the subcategories of your choice.
To include archived pupils in the report, tick the Include archived pupils checkbox.
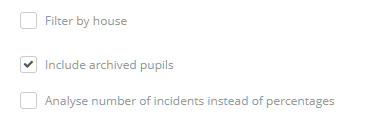
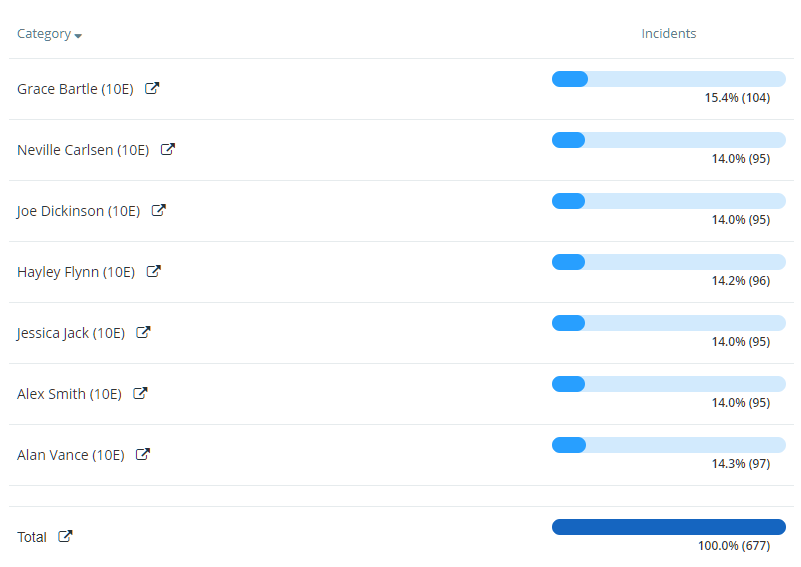
By default, session attendance reports will display the number of attendance records for each breakdown category. If Analyse number of incidents instead of percentages is ticked, the report will display the amount of times attendance was recorded instead.
![]()
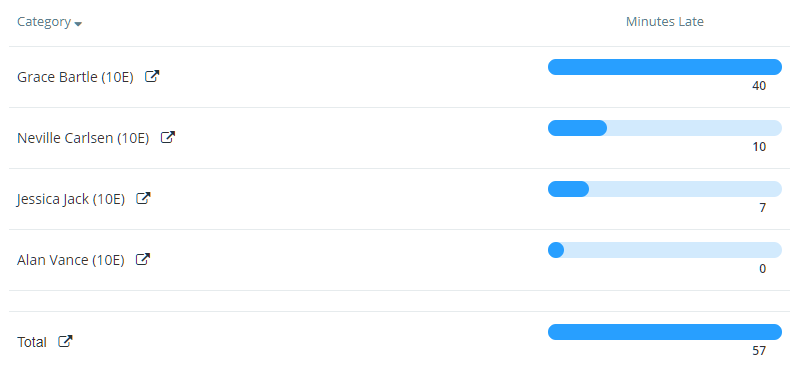
Alternatively, Analyse tick minutes late if you would like to track the late minutes total for each category in the report.
![]()
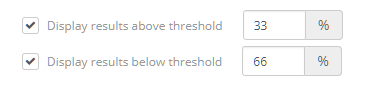
You can also filter the results of the session attendance report by displaying records above and below a threshold percentage, by ticking the Display results above threshold and Display results below threshold respectively.
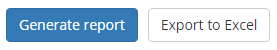
You can then generate your report by clicking the Generate report button, or export the report to an Excel spreadsheet by clicking the Export to excel button.
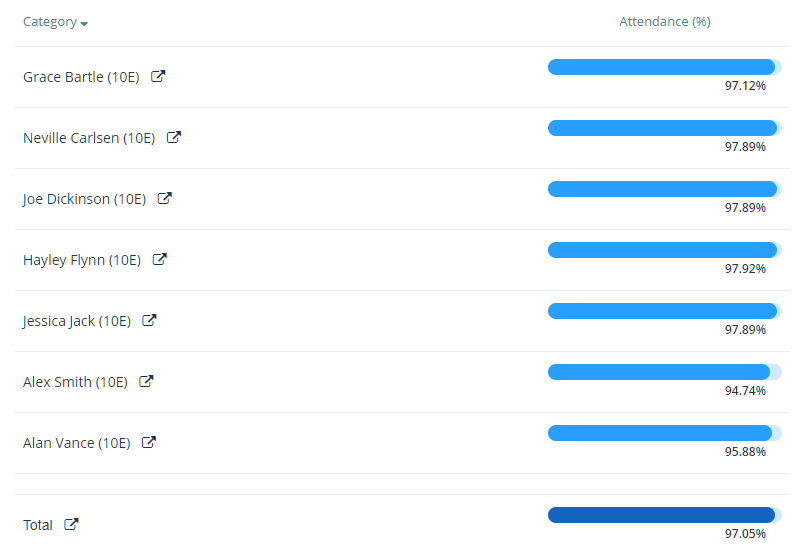
A generated report will be displayed underneath the report options and buttons.
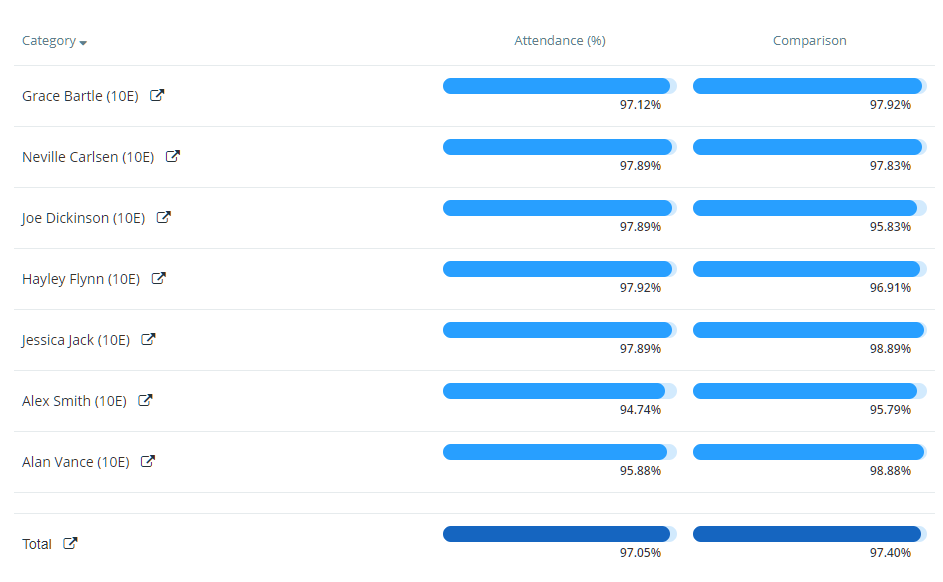
If the report is being compared to a second date range, the comparison date range will appear as faded rows underneath the first date range.
If the number of incidents is being tracked instead of the attendance percentages, each entry in the report’s results will display the number of times attendance has been marked for each category in the applied date range.
If minutes late is being tracked instead of the attendance percentages, each entry in the report’s results will display the amount of minutes late for each category in the applied date range.
Accessing detailed results
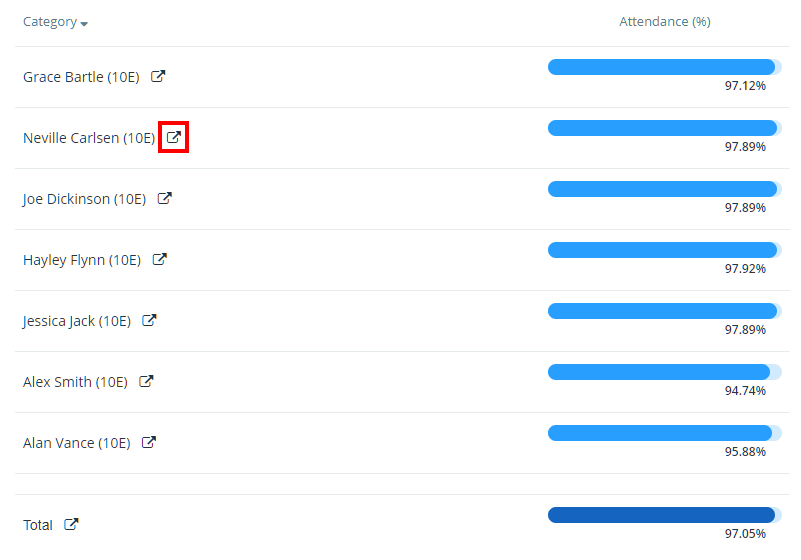
Once a report has been generated, you may wish to see a specific result in the report in more detail. To do this, click on the detailed report icon next to a entry in the report.
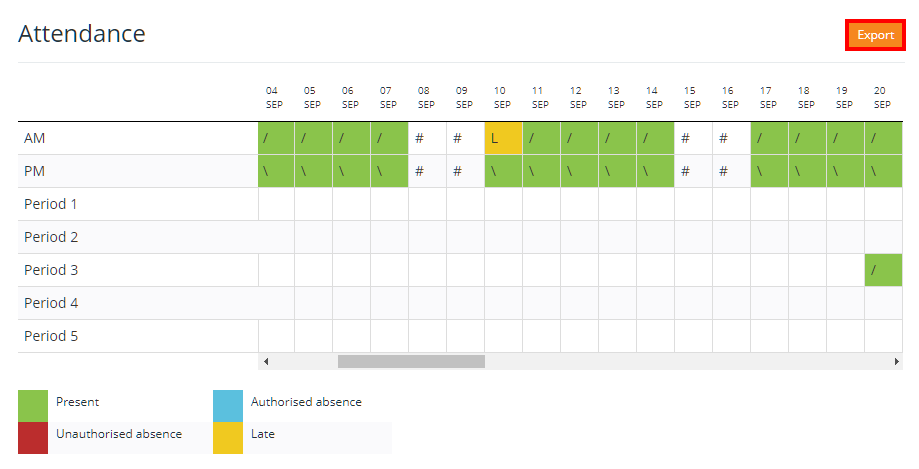
This will open up a detailed version of an entry, allowing you to interpret the data more closely. To export the detailed attendance records to Excel, click on the Export button above the attendance table.
Saving reports
If you find that you are constantly reapplying and running the same reports on a regular basis, you can save the report criteria for easier future use. To do this, set up the report criteria to your desired preferences and click on the Save for later button in the bottom right hand corner of the page.
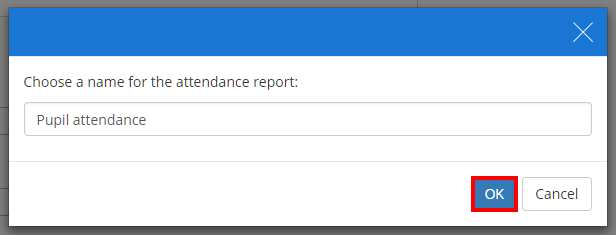
A popup will appear prompting you to name the report. Enter a name and click on the OK button to save the report.
Saved reports will appear along the top of the page. Clicking on a saved report will reapply the report’s breakdown and filter options, which can then be tweaked further.
