There may be times when you would like to display specific analytics information on a regular basis (e.g a house leaderboard). Class Charts allows you to set up your own custom analytics graphs via analytics dashboards.
To enable analytics dashboards in your school, please contact us.
Setting up a new analytics dashboard
To set up a new analytics dashboard, click on the Analytics tab along the top of the page.
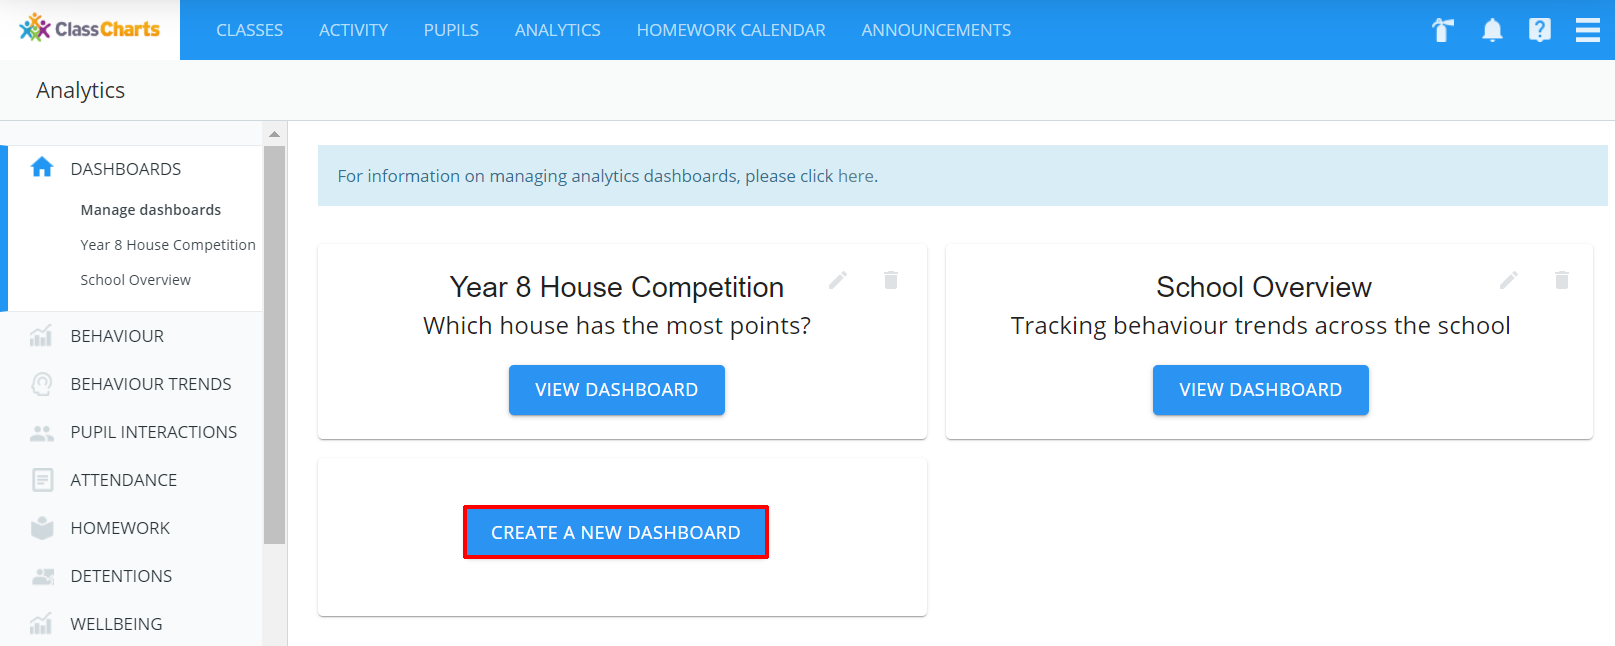
You will be presented with a list of dashboard that have been set up in your school. To create a new dashboard, click on the create a new dashboard button.
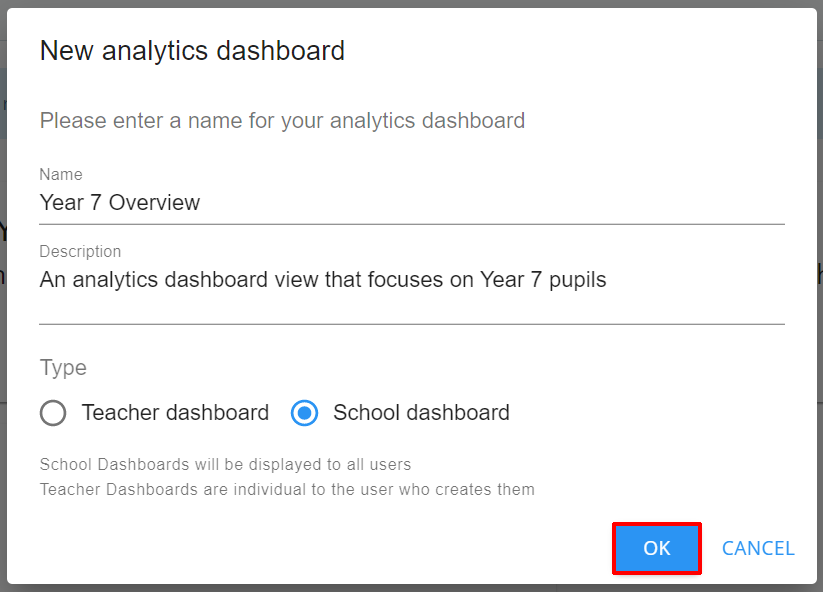
The New analytics dashboard will appear. Enter a name for the dashboard, an optional description and the dashboard type.
Click on the OK button once you have confirmed your choices.
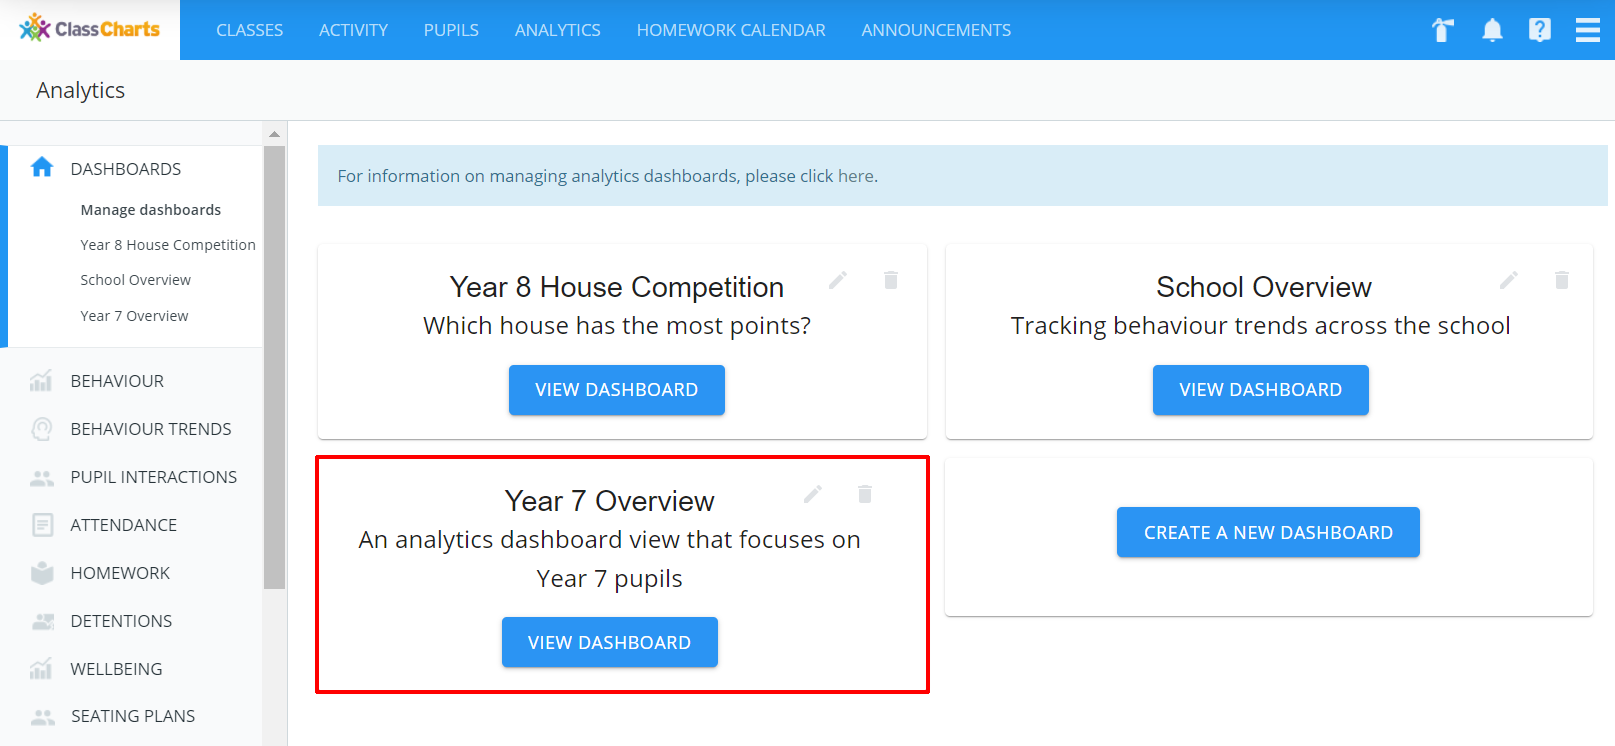
The new dashboard will now be displayed on the Manage dashboards tab.
Adding cards to a dashboard
Once a dashboard has been created, it will need to be populated with the analytics data that you want to display.
To add or make changes to the displayed data in an analytics dashboard, click on the View dashboard button for the dashboard of your choice.
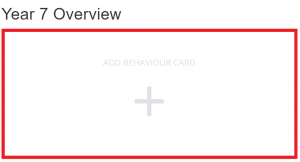
By default, newly created dashboards will be blank. Click on the Add card button to begin populating the dashboard with analytics data.
Next, select how the dashboard card should display the analytics data. This can be in the form of a leaderboard table, a bar chart or a pie chart.
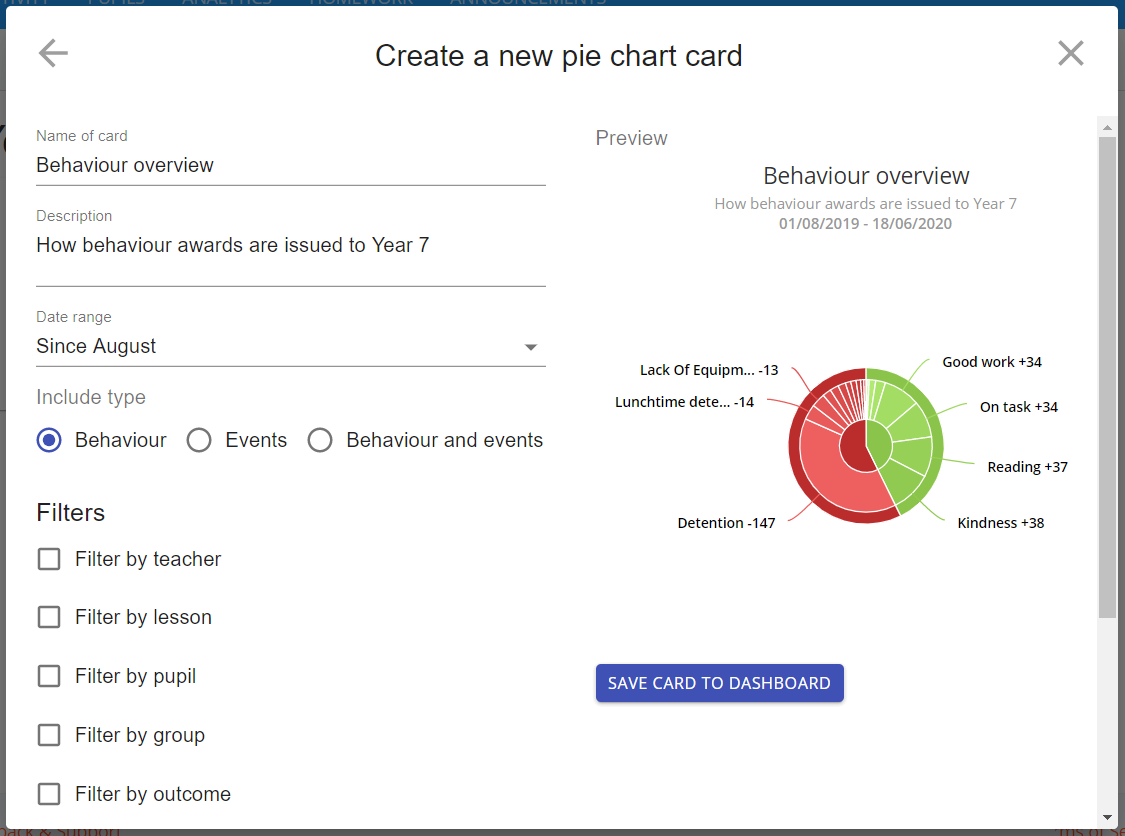
You will be presented with the Create new card popup for the dashboard card of your choice.
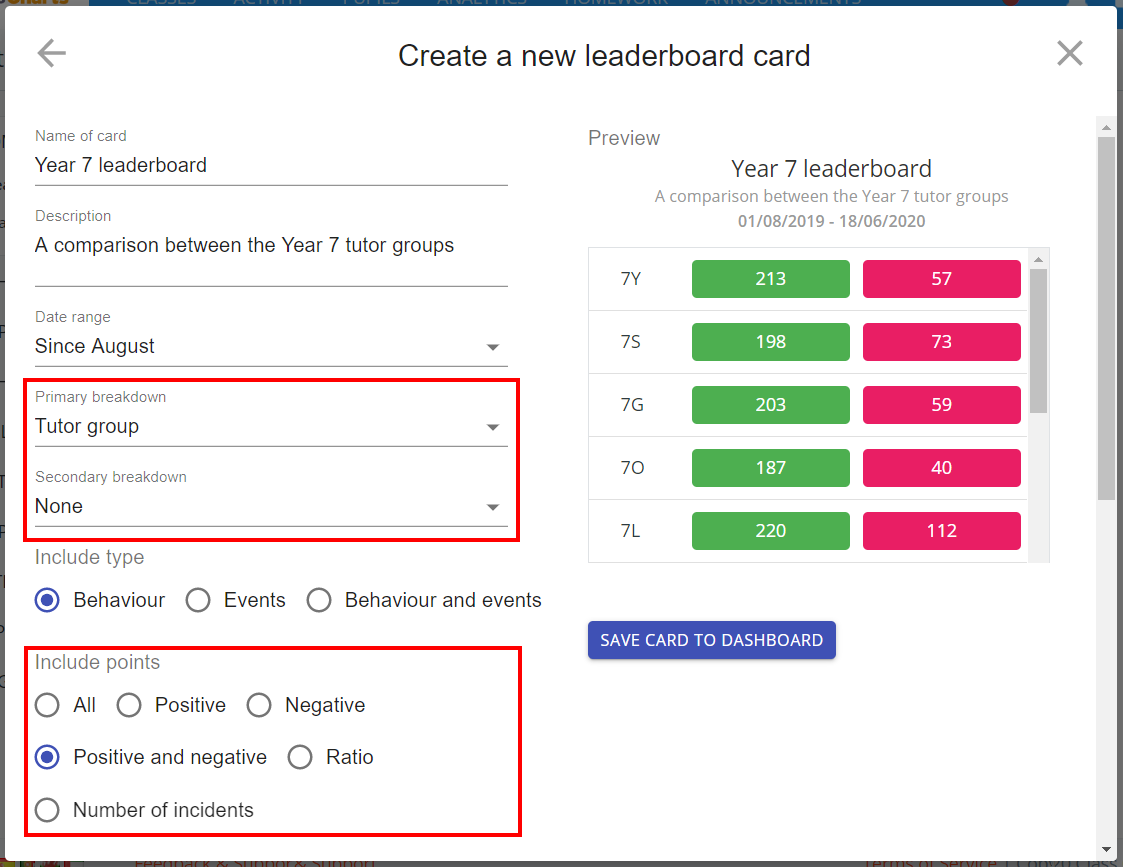
If you selected Leaderboard, you will also be able to specify primary and secondary breakdowns for the card, along with which behaviour points to display.
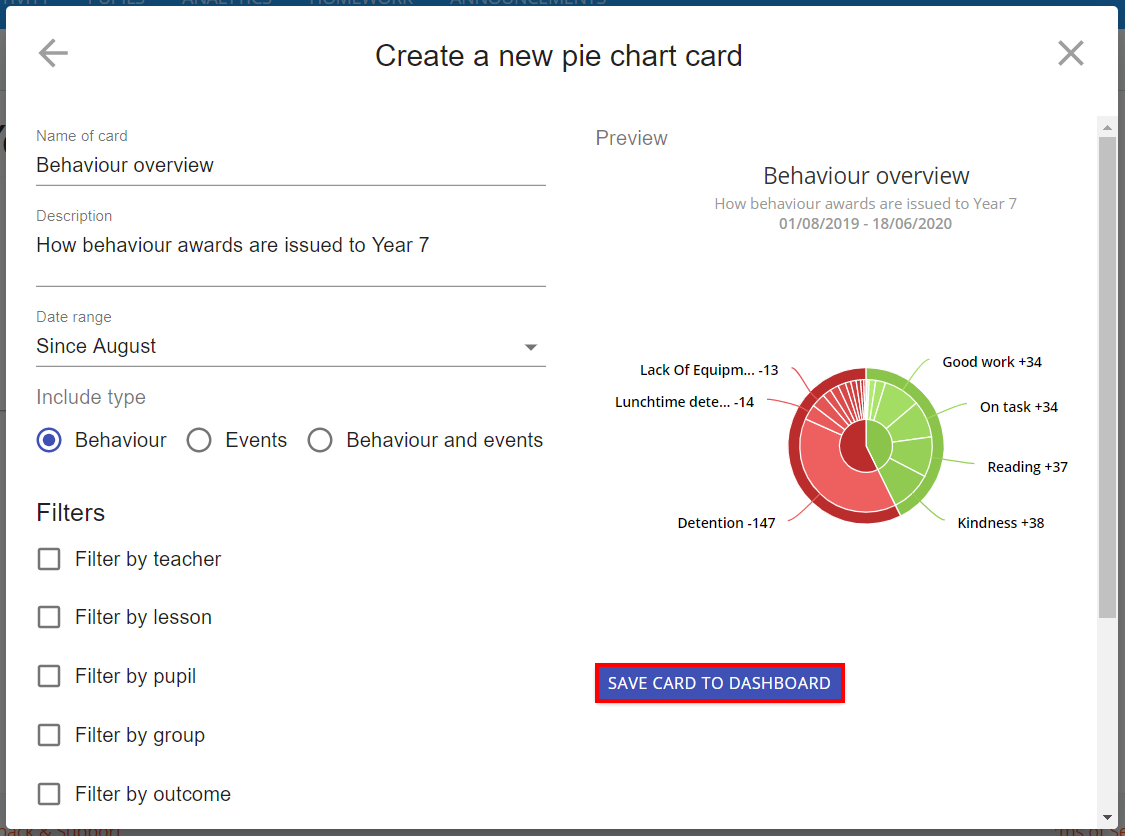
Once you are happy with your dashboard card setup, click on the Save card to dashboard button to confirm your changes.
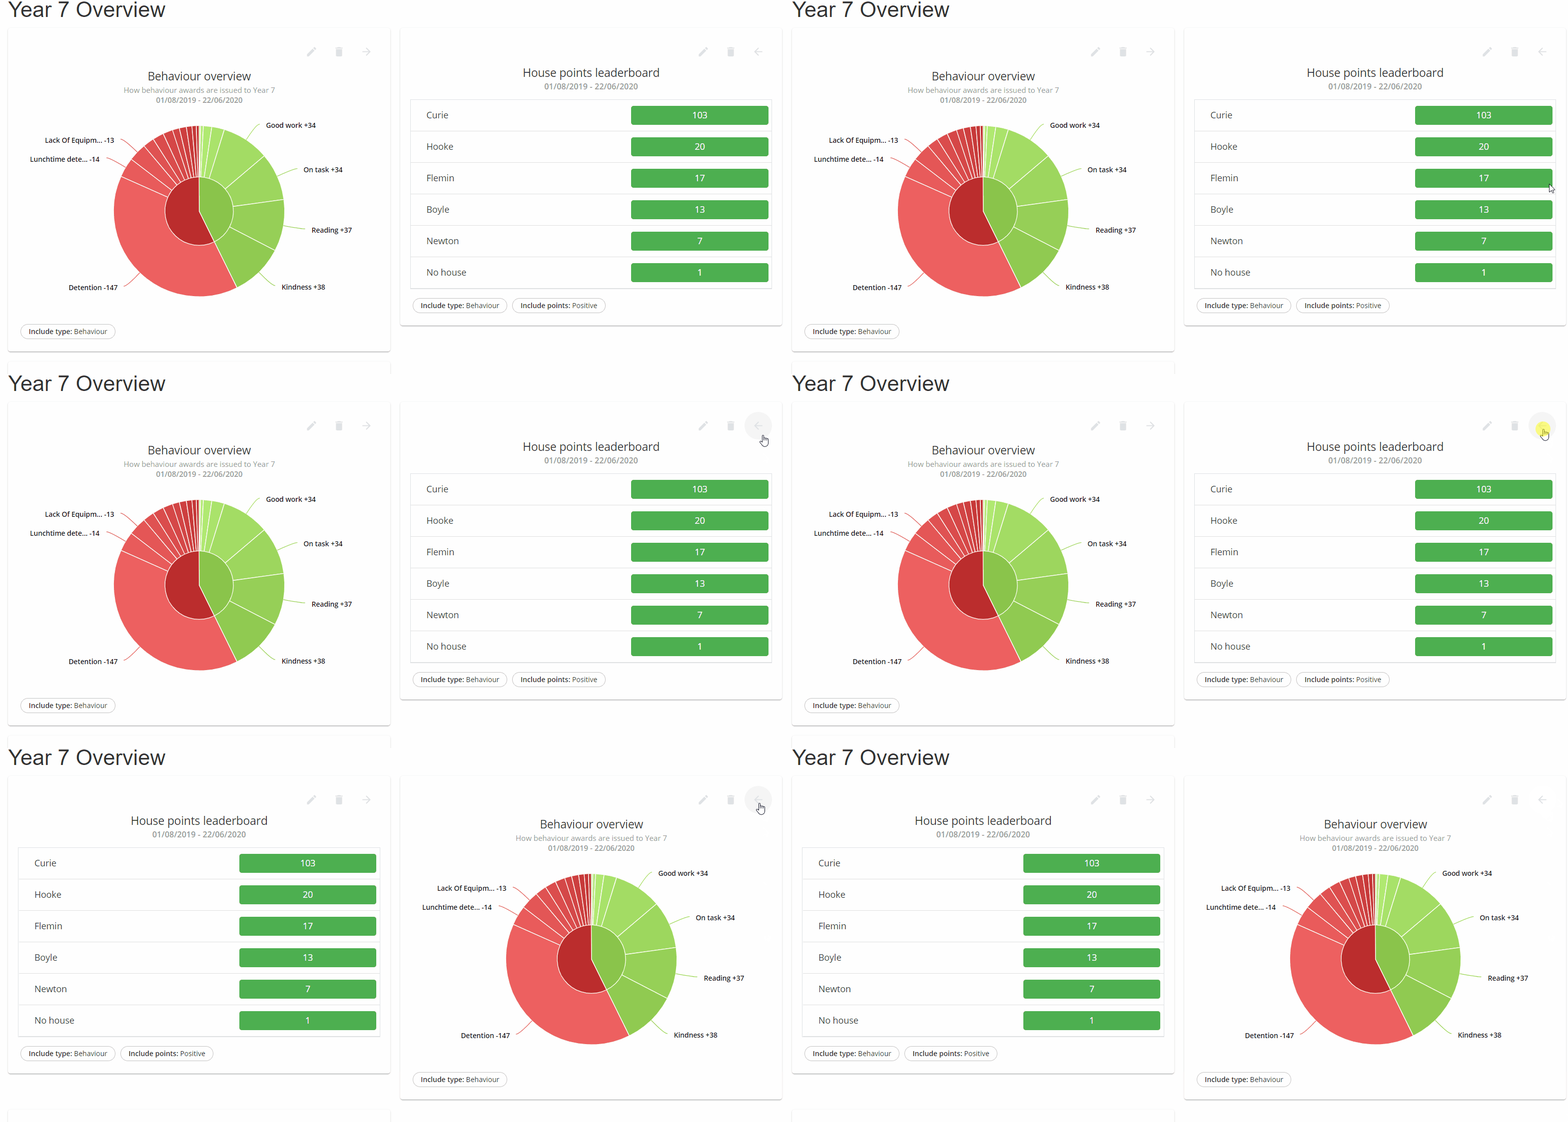
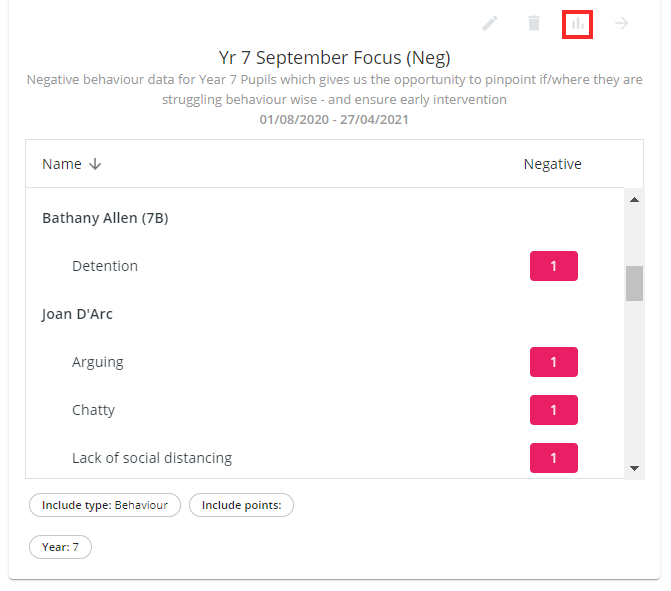
The created analytics dashboard card will now appear on the analytics dashboard. The analytics dashboard card can be edited or deleted at any time by clicking on the pencil or bin icon respectively.
Rearranging dashboard cards
If there are multiple dashboard cards, you can make changed to their displayed order. To rearrange dashboard cards, click on the arrow icons for the dashboard card of your choice.
Viewing behaviour reports from a leaderboard dashboard card
If a leaderboard dashboard card has been set up, you can quickly generate behaviour reports using the same breakdowns, filters and timeframe.
To generate a behaviour report from a leaderboard dashboard card, click on the graph icon for the leaderboard card of your choice.
The Behaviour report page will open in a new tab, with the leaderboard dashboard card criteria prepopulated for each corresponding report option.


