Once enough behaviour activity has been logged in Class Charts, staff members will be able to track how students influence each other in their classes. Please note that the required volume of behaviour data could take a few weeks to generate.
To see how a pupil influences the behaviour of other pupils within a class, click on the Classes tab along the top of the page.
![]()
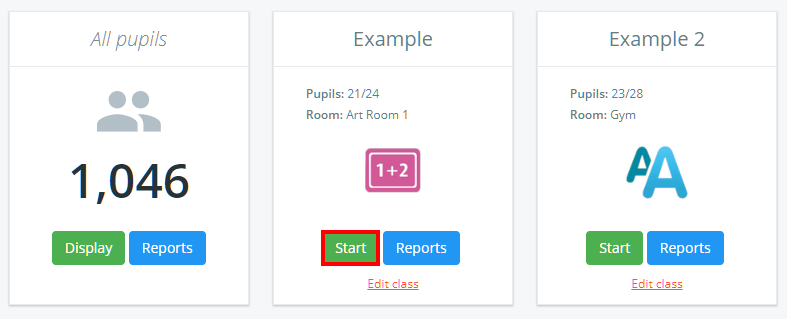
Next, click on the Start button for the class of your choice.
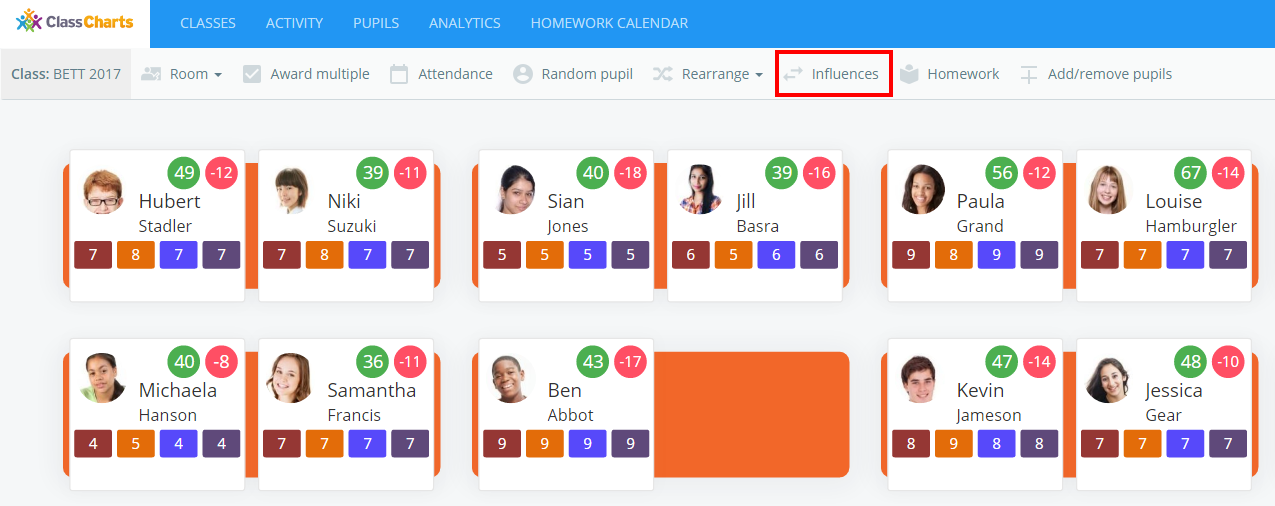
Once in the class, click on the Influences button and select a pupil by clicking on their tile. The pupil tiles will then display colours, allowing you to see the behavioural relationship other pupils have with the selected pupil.
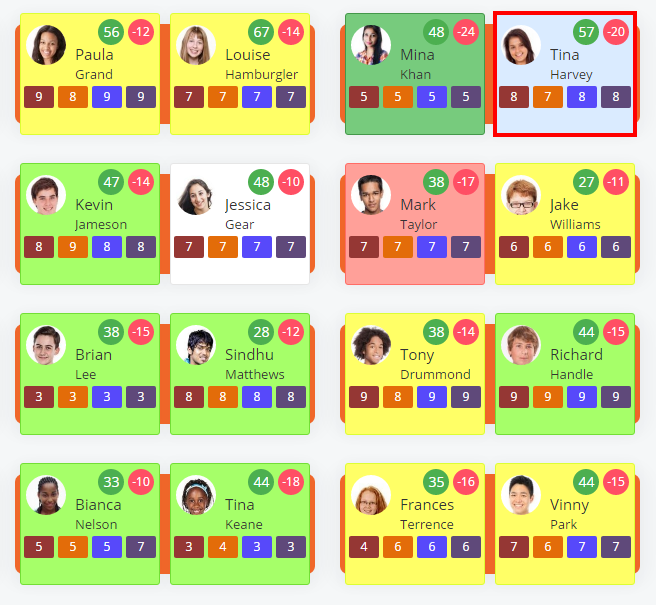
Class Charts uses a traffic light system to indicate behavioural influences between pupils. The levels of influence are represented by the following colours:
Dark green: very good influence
Green: good influence
Dark yellow: an above average influence
Yellow: an average influence
Red: bad influence
Dark red: very bad influence
Blue: the student you are looking at in terms of influences
White: no data (students have not been sitting near each other when points awarded)
In the example below, we have selected the pupil Tina Harvey and we can see she works really well with Mina Khan but doesn’t work well next to Mark Taylor.