As Class Charts is rolled out at your school, it may be useful to see an overview of how staff are using the software and often they award behaviour points.
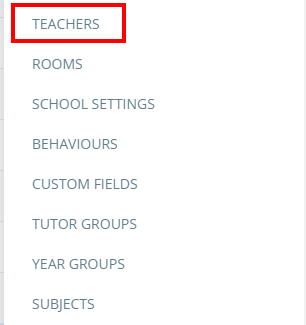
To view statistics for teachers at your school, click on the three lines menu in the top right hand corner of the page and select Teachers from the list of available options.
You will be presented with a list of staff members that have Class Charts accounts. Click on the Teacher statistics button in the top right hand corner.
A popup will appear, asking if you want to include behaviour recorded outside of Class Charts in the statistics. Confirm your choice by clicking the Yes and No buttons.
A spreadsheet will be generated, containing a list of staff members and information on how many lessons they have, how many behaviour points they have awarded, how many behaviour points are awarded per lesson, and how often the seating plan is changed.


